
Kevin Trenberth, University of Auckland
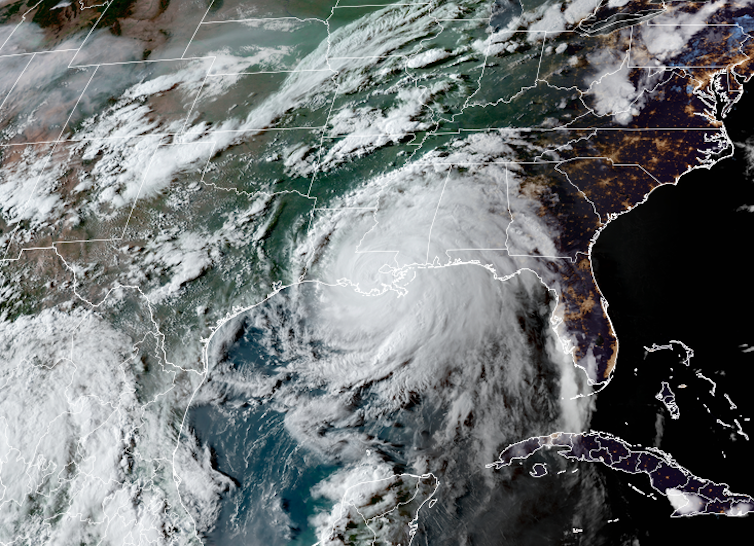
The world witnessed record-breaking climate and weather disasters in 2021, from destructive flash floods that swept through mountain towns in Europe and inundated subway systems in China and the U.S., to heat waves and wildfires. Typhoon Rai killed over 400 people in the Philippines; Hurricane Ida caused an estimated US$74 billion in damage in the U.S.
Globally, it was the sixth hottest year on record for surface temperatures, according to data released by NASA and the National Oceanic and Atmospheric Administration in their annual global climate report on Jan. 13, 2022. But under the surface, ocean temperatures set new heat records in 2021.
As climate scientist Kevin Trenberth explains, while the temperature at Earth’s surface is what people experience day to day, the temperature in the upper part of the ocean is a better indicator of how excess heat is accumulating on the planet.
The Conversation spoke with Trenberth, coauthor of a study published on Jan. 11, 2022, by 23 researchers at 14 institutes that tracked warming in the world’s oceans.
RAMMB/CIRA/Colorado State University
Your latest research shows ocean heat is at record highs. What does that tell us about global warming?
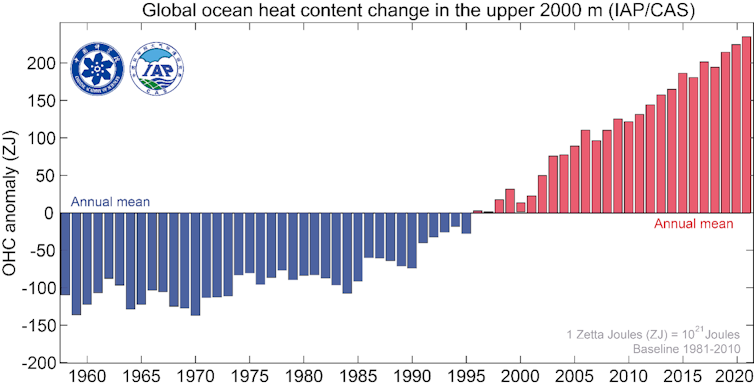
The world’s oceans are hotter than ever recorded, and their heat has increased each decade since the 1960s. This relentless increase is a primary indicator of human-induced climate change.
As oceans warm, their heat supercharges weather systems, creating more powerful storms and hurricanes, and more intense rainfall. That threatens human lives and livelihoods as well as marine life.
The oceans take up about 93% of the extra energy trapped by the increasing greenhouse gases from human activities, particularly burning fossil fuels. Because water holds more heat than land does and the volumes involved are immense, the upper oceans are a primary memory of global warming. I explain this in more detail in my new book “The Changing Flow of Energy Through the Climate System.”
Lijing Cheng
Our study provided the first analysis of 2021’s ocean warming, and we were able to attribute the warming to human activities. Global warming is alive and well, unfortunately.
The global mean surface temperature was the fifth or sixth warmest on record in 2021 (the record depends on the dataset used), in part, because of the year-long La Niña conditions, in which cool conditions in the tropical Pacific influence weather patterns around the world.
There is a lot more natural variability in surface air temperatures than in ocean temperatures because of El Niño/La Niña and weather events. That natural variability on top of a warming ocean creates hot spots, sometimes called “marine heat waves,” that vary from year to year. Those hot spots have profound influences on marine life, from tiny plankton to fish, marine mammals and birds. Other hot spots are responsible for more activity in the atmosphere, such as hurricanes.
While surface temperatures are both a consequence and a cause, the main source of the phenomena causing extremes relates to ocean heat that energizes weather systems.
NASA
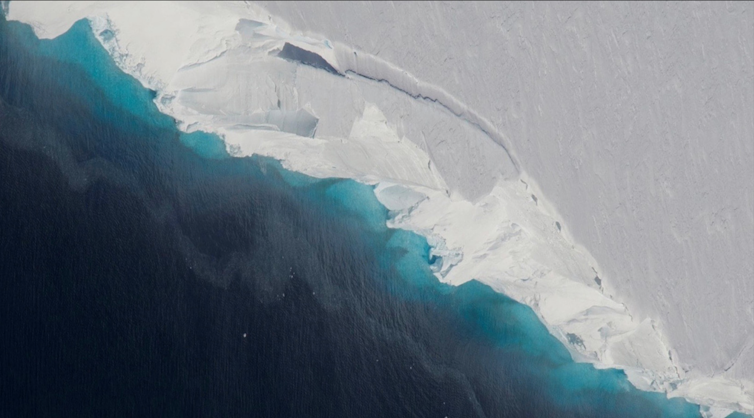
We found that all oceans are warming, with the largest amounts of warming in the Atlantic Ocean and in the Southern Ocean surrounding Antarctica. That’s a concern for Antarctica’s ice – heat in the Southern Ocean can creep under Antarctica’s ice shelves, thinning them and resulting in calving off of huge icebergs. Warming oceans are also a concern for sea level rise.
In what ways does extra ocean heat affect air temperature and moisture on land?
The global heating increases evaporation and drying on land, as well as raising temperatures, increasing risk of heat waves and wildfires. We’ve seen the impact in 2021, especially in western North America, but also amid heat waves in Russia, Greece, Italy and Turkey.
The warmer oceans also supply atmospheric rivers of moisture to land areas, increasing the risk of flooding, like the U.S. West Coast has been experiencing.
2021 saw several destructive cyclones, including Hurricane Ida in the U.S. and Typhoon Rai in the Philippines. How does ocean temperature affect storms like those?
Warmer oceans provide extra moisture to the atmosphere. That extra moisture fuels storms, especially hurricanes. The result can be prodigious rainfall, as the U.S. saw from Ida, and widespread flooding as occurred in many places over the past year.
The storms may also become more intense, bigger and last longer. Several major flooding events have occurred in Australia this past year, and also in New Zealand. Bigger snowfalls can also occur in winter provided temperatures remain below about freezing because warmer air holds more moisture.

Cheryl Baldicantos/AFP via Getty Images
If greenhouse gas emissions slowed, would the ocean cool down?
In the oceans, warm water sits on top of cooler denser waters. However, the oceans warm from the top down, and consequently the ocean is becoming more stratified. This inhibits mixing between layers that otherwise allows the ocean to warm to deeper levels and to take up carbon dioxide and oxygen. Hence it impacts all marine life.
We found that the top 500 meters of the ocean has clearly been warming since 1980; the 500-1,000 meter depths have been warming since about 1990; the 1,000-1,500 meter depths since 1998; and below 1,500 meters since about 2005.
The slow penetration of heat downward means that oceans will continue to warm, and sea level will continue to rise even after greenhouse gases are stabilized.
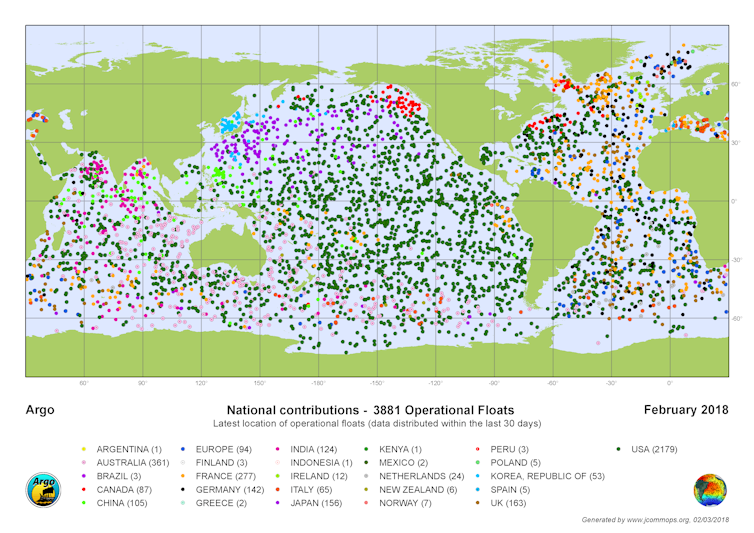
The final area to pay attention to is the need to expand scientists’ ability to monitor changes in the oceans. One way we do this is through the Argo array – currently about 3,900 profiling floats that send back data on temperature and salinity from the surface to about 2,000 meters in depth, measured as they rise up and then sink back down, in ocean basins around the world. These robotic, diving and drifting instruments require constant replenishment and their observations are invaluable.
Howard Freeland, 2018, CC BY-ND
[Understand new developments in science, health and technology, each week. Subscribe to The Conversation’s science newsletter.]![]()
Kevin Trenberth, Distinguished Scholar, NCAR; Affiliated Faculty, University of Auckland
This article is republished from The Conversation under a Creative Commons license. Read the original article.


